Custom Sources – TimeSeries
See also:
How to create a Custom Relationship source
How to create a Custom RelationshipData source
Introduction to TimeSeries, TimeSeries(), Entities, Relationship(), RelationshipData()
Examples:
Example 1 – An assessment of the day’s close price
Example 2 – Calculate the five-day rolling average close price
How to create a Custom TimeSeries source
Consider the following TimeSeries() function that returns Close Prices:
The output of the TimeSeries function is as follows:
| Entity | TimeSeries | Date | Value |
| AGL | Close Price | 2012/10/01 | 25604 |
| AGL | Close Price | 2012/10/02 | 25369 |
| AGL | Close Price | 2012/10/03 | 24684 |
| AGL | Close Price | 2012/10/04 | 24970 |
| AGL | Close Price | 2012/10/05 | 25402 |
| AGL | Close Price | 2012/10/08 | 25639 |
| AGL | Close Price | 2012/10/09 | 25626 |
| AGL | Close Price | 2012/10/10 | 25725 |
These values are retrieved from the database. The requirement in the following examples is to create real time calculations based on the underlying close price values. The output from these calculations is not stored in the database, as the output changes whenever the underlying data changes.
Click on the Custom Sources button on the Quintessence home page:

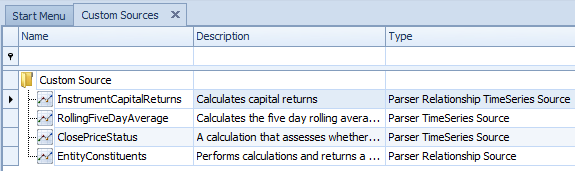
The Custom Source window opens and lists any existing custom sources:
Example 1 – An assessment of the day’s close price
This example assesses whether the close price has gone up or down since the previous day.
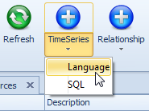
To create a new custom TimeSeries source, click on the TimeSeries button and click ‘Language’. If the custom TimeSeries needs to connect to an external database to retrieve data, the selection is then ‘SQL’:
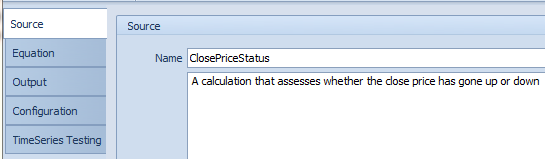
When the custom TimeSeries source window opens, add a name and description for the new custom source:
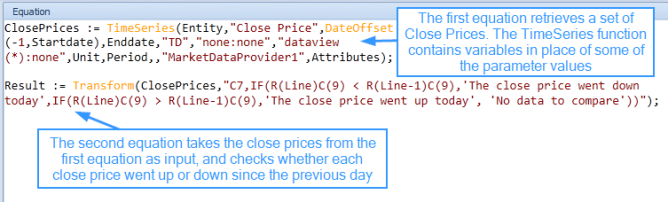
Select the equation tab. Using the equation editor enter the equations that perform the required calculations and output the results:
- An equation that returns close prices from the database
- An equation that performs calculations on the close prices
The TimeSeries function can contain variables in place of the parameter values that are not constant, for example ‘Entity’. The second equation in this example uses Quintessence Row Column syntax.
Note:
Originally Custom TimeSeries returned a single value. A single ‘Date’ parameter was used for both Start Date and End Date. Therefore a single calculation was performed for every date passed to the custom source. It is now possible to send a range of dates to the custom source and to retrieve a block of data:
- Click on the Configuration tab
- Next to ‘Dates’ check ‘Group’
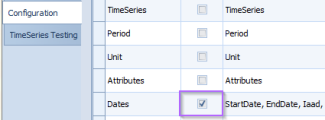
When returning to the Equation tab, instead of a single date variable for the custom source, two date variables will be listed under Variables – one for Start Date and one for End Date.
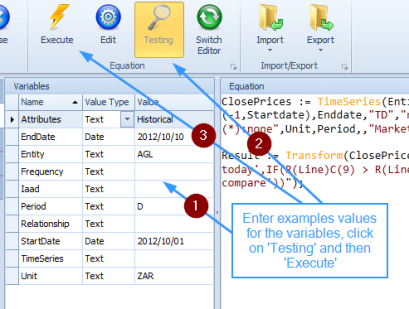
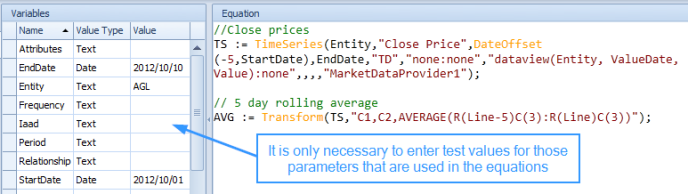
To test the equations, enter test values for the variables, in this case ‘Entity’, ‘Startdate’, ‘Enddate’,’Unit’, ‘Period’ and ‘Attributes’. Click on the ‘Testing’ button followed by the ‘Execute’ button:
Note:
All possible TimeSeries parameters are listed under Variables. It is only necessary to enter test values for those parameters that are used in the Equation.
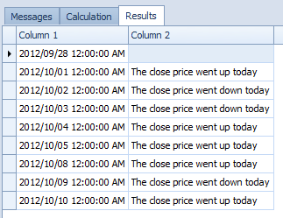
The test results are listed below:
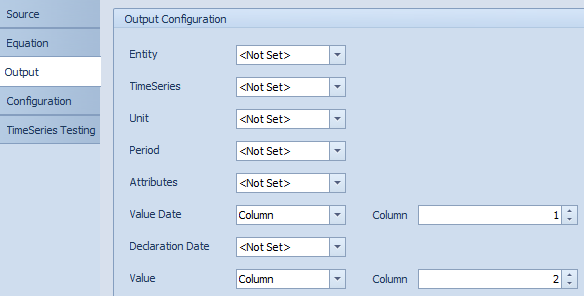
On the Output tab, map the results to their output columns:
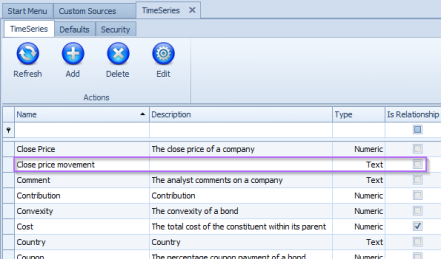
This custom source can now be utilised in a TimeSeries() function, either in the Quintessence application or using the Excel Addin. The custom source will obtain its variable parameter values from the TimeSeries function in which it is used. A new TimeSeries factor is required (see How to create a TimeSeries factor). This factor will be requested from the custom source within the TimeSeries() function. In this example, the factor is named ‘Close price movement’:
The following TimeSeries() function requests ‘Close Price’ and the new factor from the custom source:
The TimeSeries returns ‘Close Price’ from the source ‘MarketDataProvider1’, and ‘Close price movement’ from the custom source ‘ClosePriceStatus’, yielding the following result:
| Date | Price | Status |
| 2012/10/01 | 25604 | The close price went up today |
| 2012/10/02 | 25369 | The close price went down today |
| 2012/10/03 | 24684 | The close price went down today |
| 2012/10/04 | 24970 | The close price went up today |
| 2012/10/05 | 25402 | The close price went up today |
| 2012/10/08 | 25639 | The close price went up today |
| 2012/10/09 | 25626 | The close price went down today |
| 2012/10/10 | 25725 | The close price went up today |
Note:
Using ‘Row’ as the value for the TimeSeries view parameter ensures that the requested factors are listed alongside each other rather than one factor being listed below the other.
Example 2 – Calculate the five-day rolling average close price
Create another custom TimeSeries source and add a name and description.
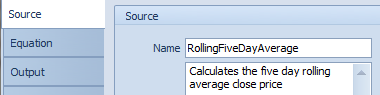
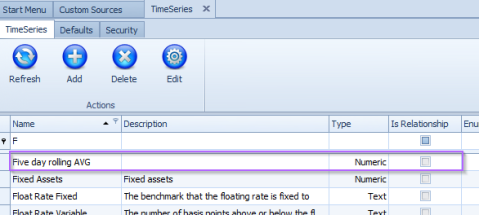
A new TimeSeries factor is required (see How to create a TimeSeries factor). This factor will be requested from the custom source within the TimeSeries() function. In this example, the factor is named ‘Five day rolling AVG’:
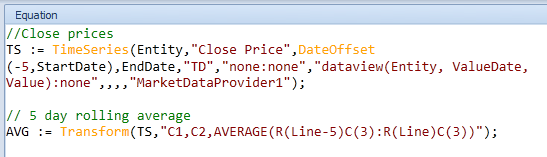
Select the equation tab. Using the equation editor enter the equations that perform the required calculations and output the results:
- An equation that returns close prices from the database
- An equation that performs calculations on the close prices
Test the equations by entering test values for the variables:
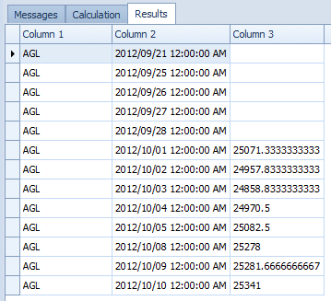
The test results:
This custom source can now be utilised in a TimeSeries() function, either in the Quintessence application or using the Excel Addin. In this example, this source will be added to the TimeSeries() function shown in the previous example:
The TimeSeries function returns ‘Close Price’ from the source ‘MarketDataProvider1’, ‘Close price movement’ from the custom source ‘ClosePriceStatus’, and ‘Five day rolling AVG’ from the custom source ‘RollingFiveDayAverage’, yielding the following result:
| Date | Price | Status | Five-day rolling average |
| 2012/10/01 | 25604 | The close price went up today | 25071.33 |
| 2012/10/02 | 25369 | The close price went down today | 24957.83 |
| 2012/10/03 | 24684 | The close price went down today | 24858.83 |
| 2012/10/04 | 24970 | The close price went up today | 24970.50 |
| 2012/10/05 | 25402 | The close price went up today | 25082.50 |
| 2012/10/08 | 25639 | The close price went up today | 25278.00 |
| 2012/10/09 | 25626 | The close price went down today | 25281.67 |
| 2012/10/10 | 25725 | The close price went up today | 25341.00 |