Reports
How to view the list of available reports
How to access a report in Excel
How to import and export reports
How to build report equations using Excel named ranges
Introduction
Quintessence reports are constructed using the Quintessence language and Quintessence equation editors. Reports can be:
- Accessed from the Quintessence Excel® Addin
- Used within Quintessence Data feeds
- Accessed by other Reports
- Used as function input parameter values for array type parameters.
How to view the list of available reports
From the Quintessence Start Menu, click on the ‘Reports’ button:
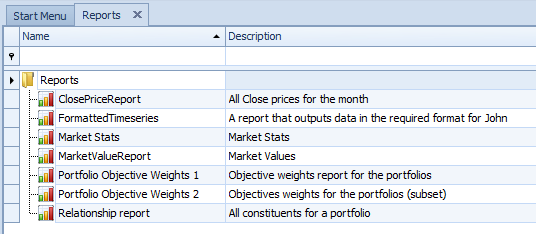
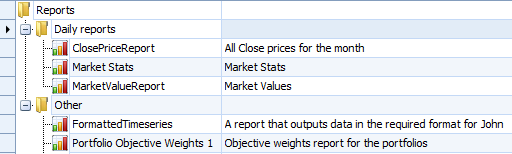
Any existing reports are listed:
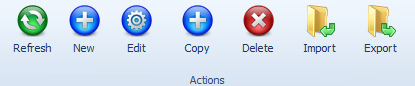
Report actions
Using the Actions toolbar buttons, new reports can be added; existing reports can be edited or deleted; and reports can be copied, exported and imported:
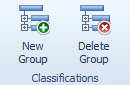
Report classifications
Reports can be grouped into folders. Click on the ‘New Group’ button to create a new folder. Existing reports can be dragged into new groups. Click on the ‘Delete Group’ button to delete a folder.
Note:
When deleting a folder, the reports in that folder are not deleted but are moved up to the top level Reports group
How to create a report
This example describes the creation of a report that calculates the minimum close price, maximum close price, average close price and median close price of a portfolio’s constituents between two dates.
- To create a new report click on the ‘New’ button:

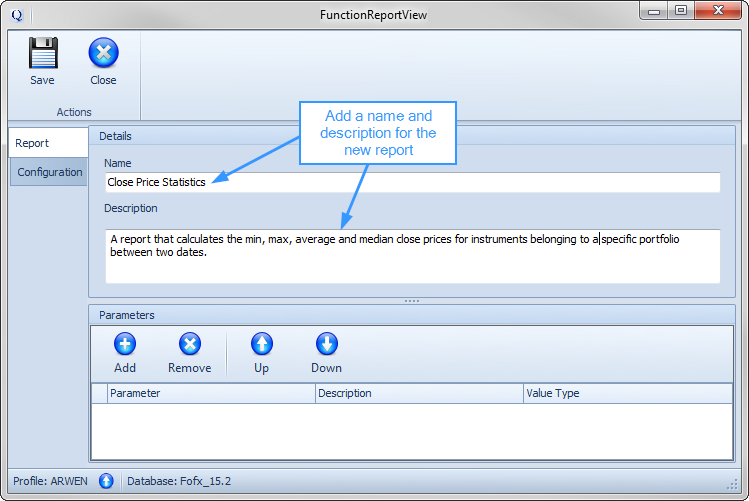
- When the report editor opens, add a name and description for the report:
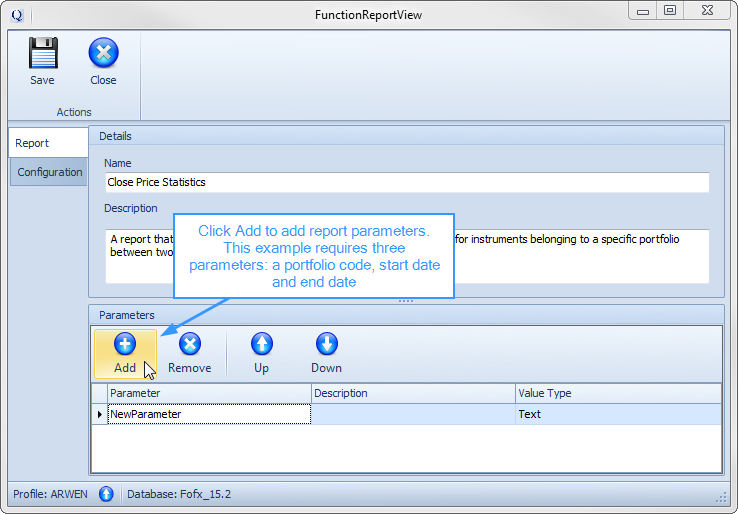
The report will be run for a specified portfolio between two dates. Therefore three parameters are required:
- Portfolio (text)
- StartDate (date)
- EndDate (date)
- Click on the ‘Add’ button to add a new parameter:
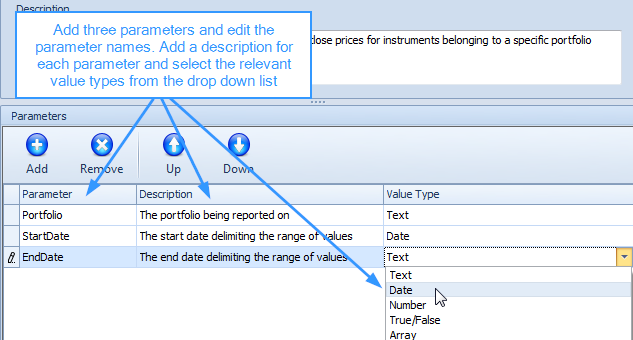
- Add three parameters and provide names, descriptions and value types for each parameter:
- Click on the Configuration tab to create the report functionality.
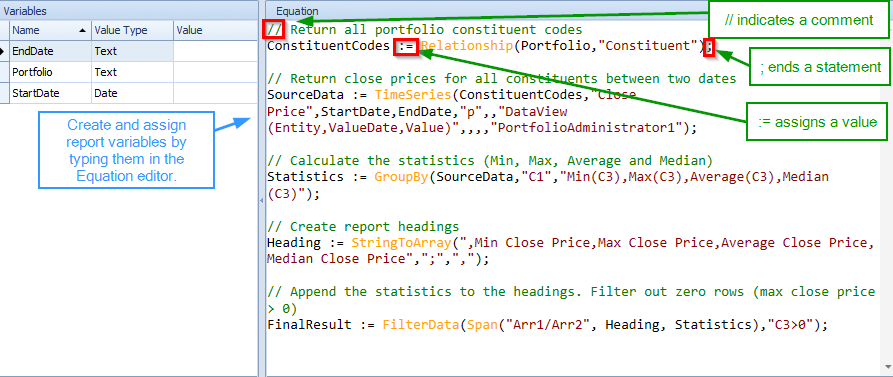
The report will be created by building up a series of equations and one final equation. The final equation depends on the prior equations, and returns the final report content:
| Equation | Description |
| ConstituentCodes := Relationship(Portfolio,”Constituent”); | The value of ‘Portfolio’ is determined from the input parameter Portfolio. The Relationship() function is used to return the constituent instruments of the Portfolio. |
| SourceData := TimeSeries(ConstituentCodes,”Close Price”, StartDate,EndDate,”p”,,”DataView (Entity,ValueDate,Value)”,,,,”PortfolioAdministrator1″); |
The TimeSeries() function returns the Close Prices for the list of constituent codes, which it obtains from the ConstituentCodes equation defined above. Values are returned between two dates; these are obtained from the StartDate and EndDate parameters. |
| Statistics := GroupBy(SourceData,”C1″,”Min(C3),Max(C3),Average(C3),Median(C3)”); | The GroupBy() function is used to obtain statistics from the SourceData equation defined above. |
| Heading := StringToArray(“,Min Close Price,Max Close Price,Average Close Price, Median Close Price”,”;”,”,”); | A Heading row is constructed for use by the report output. Headings are created for the four statistic columns using the StringToArray() function. |
| FinalResult := FilterData(Span(“Arr1/Arr2″, Heading, Statistics),”C3>0”); | The equation that produces the final report output uses the Span() function to arrange the Heading row above the Statistics. |
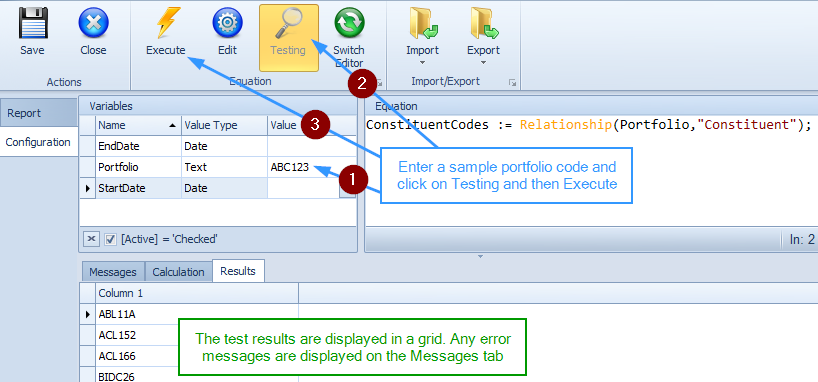
- Use the equation editor to construct the report. Type in the first equation. Each equation’s output can be tested during development by clicking on the ‘Testing’ and ‘Execute’ buttons:
- Type in the remaining equations as listed in the table above:
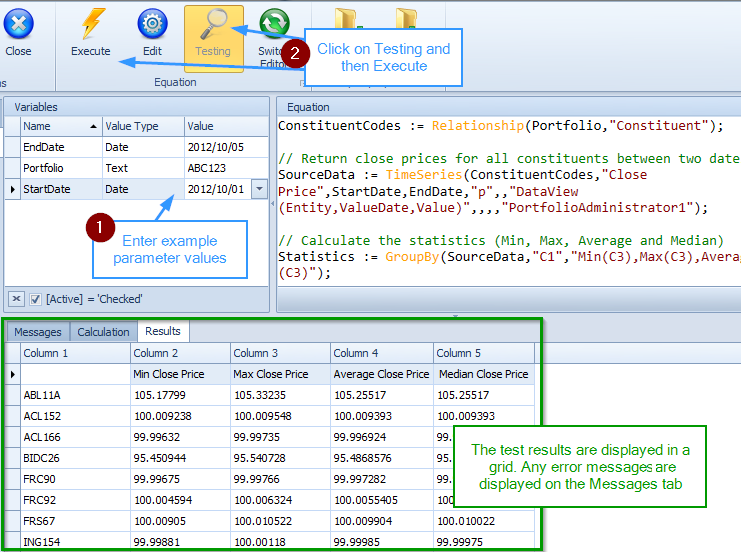
- The final result can be tested once all equations have been entered. Test the report by entering example parameter values and clicking on the ‘Testing’ and ‘Execute’ buttons:
How to access a report in Excel
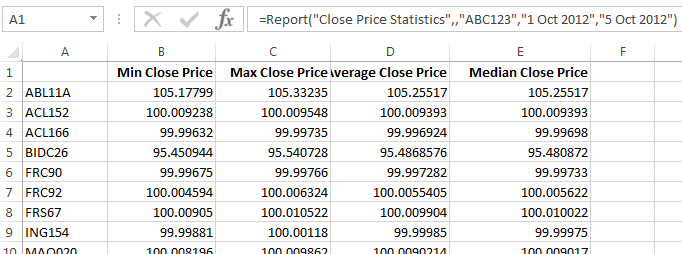
Open Excel (with the Quintessence Excel® Addin enabled). Use the Report() function to test the report that was created in the example above. The report function requires the report name and any parameter values. These values should be supplied in the same order that the parameters were created in the report (in this example, Portfolio, StartDate, EndDate). The results are listed in the spreadsheet:
How to import and export reports
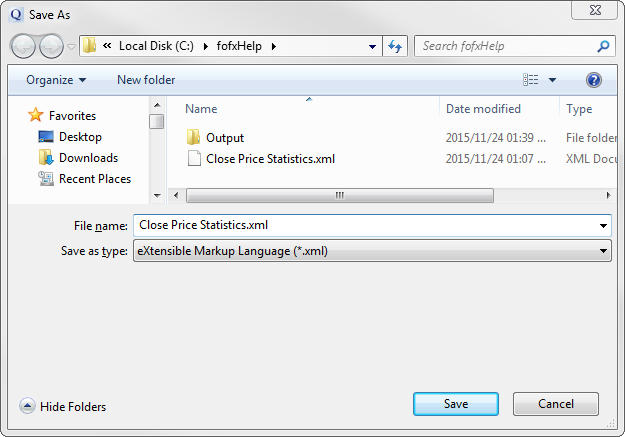
To export a report, select a report in the list of reports and click on the ‘Export’ button:

A ‘Save As’ window will open and prompt for a file name and path. The file format is XML:
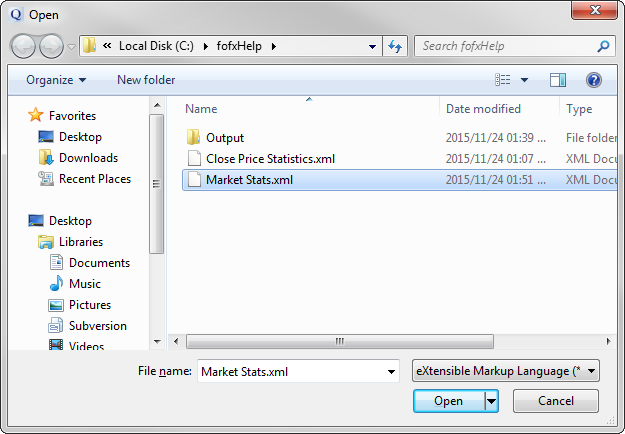
To import a report, click on the ‘Import’ button:

A browser window will open. Browse to, and select the target XML file and click ‘Open’ to import the report and add it to the list of reports in Quintessence:
‘2015 f(x) All rights reserved