How to build formulas in Excel
See also:
å
Other use case examples:
- How to create a graphical return comparison in Excel using the Quintessence Excel® Addin functions
- How to create cumulative returns using the Quintessence Excel® Addin functions
Formulas in Excel can become quite long when many functions are nested as parameters. This can make the formulas difficult to read, for example:
The process of building formulas in Excel can be simplified by using Excel’s named ranges.
Named ranges
This example builds up a formula in Excel using a number of named ranges as building blocks. These named ranges can reference single static values, ranges or functions.
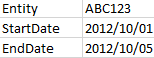
- Open a blank Excel spreadsheet and enter an entity code, start date and end date:
- Click into the cell containing the entity code, in this example, ABC123.
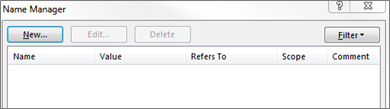
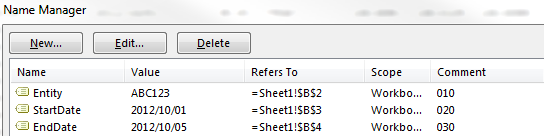
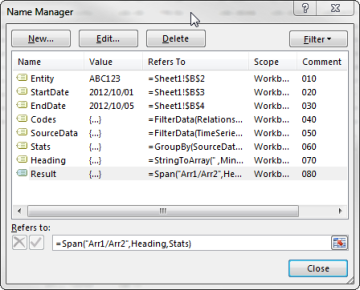
- Click Ctrl + F3 to open Excel‘s Name Manager:
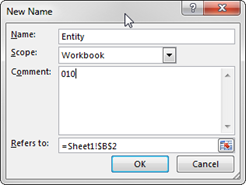
- Click New, and type a name: Entity.
- The comments will be used by a Quintessence report (described below) to order the named ranges (See Creating a Quintessence report from an Excel spreadsheet below). The comments are ordered as text. Type in ‘010‘:
- Repeat the action for Start Date and End Date, using ‘020‘ and ‘030‘ for the comments respectively. The list of names should look as follows:
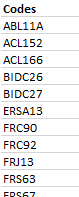
- In an Excel cell, add a heading ‘Codes‘ and under Codes, type in the following function (note that the function uses the named range ‘Entity‘ as an input parameter):
|
=Relationship(Entity, “Constituent”) |
This provides the constituent instruments linked to portfolio ‘ABC123‘:
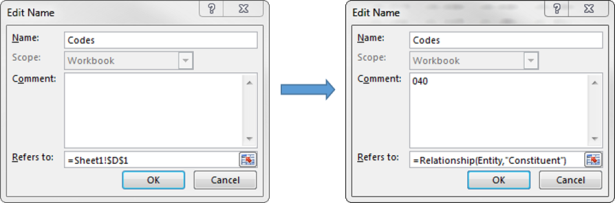
- Copy the function text and click ‘Esc‘. Click on the heading ‘Codes‘ and then CTRL + F3 to open the Name Manager.
- Create a new named range. Note that the name ‘Codes‘ is automatically picked up from the selected heading ‘Codes‘. Replace the spreadsheet reference with the copied function text and type ‘040‘ into the comment section:
- Repeat this for the following functions as shown below:
SourceData
Stats
Heading
Result
Note:
The Span() function uses ‘/‘ to denote that the first array ‘Heading‘ should be stacked above the second array ‘Stats‘.
The spreadsheet will look similar to the following one, although it could be organised differently. Working horizontally makes the building blocks easier to follow:
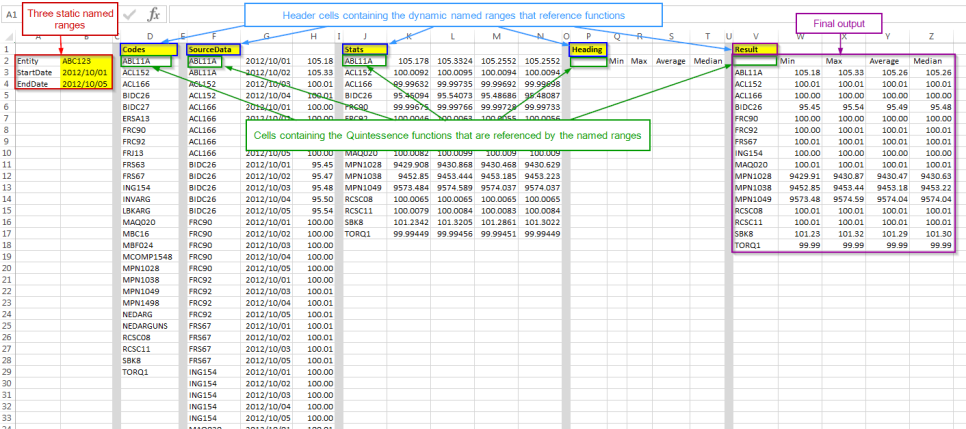
The final set of named ranges listed in the name manager, ordered by comment, should look as follows:
- This example demonstrated building up output using smaller building blocks so that the functions are easier to read and follow.
- Save the spreadsheet and name it: StatsReport.
Note:
Despite the complexity of the formula, there are only three variables underpinning it:
Entity = ABC123
StartDate = 2012/10/01
EndDate = 2012/10/05
Note:
The following function returns the same final output as the one above, but it is difficult to read.
StringToArray(” ,Min,Max,Average,Median”,”;”,”,”),
GroupBy(TimeSeries(Relationship
(“ABC123″,”Constituent”),”Close Price”,”1 Oct 2012″,”5 Oct 2012″,”p”,,”DataView(Entity,ValueDate,Value)”,,,,”PortfolioAdministrator1″),”C1″,”min(C3),max(C3),Average(C3),Median(C3)”))
If the output is something that is produced regularly for different portfolios by one or more people, it would be useful to remove the complexity for colleagues who want to retrieve the same information from within any spreadsheet by simply providing three values (entity, start date and end date). This can be achieved by creating a generic report in the Quintessence application that can be accessed and reused from Excel.
When creating the report, there is no need to repeat all the work already done ‘ it can be imported from the spreadsheet ‘StatsReport‘, as shown in the next section.
Creating a Quintessence report from an Excel spreadsheet
- Open Quintessence and click on the Reports tab:

- Create a new report by clicking on the New button:

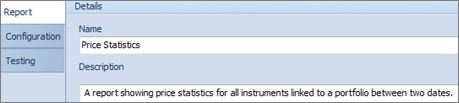
- Enter a name and description for the report:
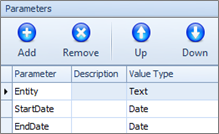
- To add report parameters click on the Add button:
![]()
- Create three parameters with the same names as the three static variables created in the StatsReport in Excel: StartDate and EndDate of type ‘Date‘, and Entity of type ‘Text‘.
- Save the report and click on the Configuration tab. Then click on the import button:

- A browser window will open. Browse to the spreadsheet created earlier ‘StatsReport.xlsx‘. Make sure the drop down option box next to file name is set to ‘All Files (*.*)‘. Select the spreadsheet.
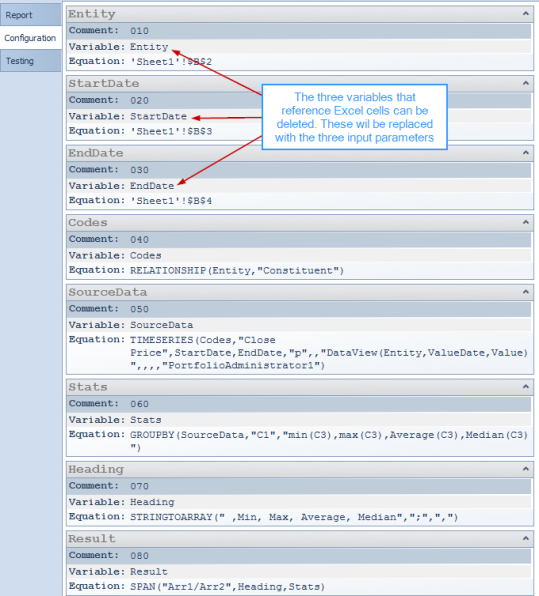
- A window will open showing the Excel named ranges within the report. Click on ‘Import‘. The configuration window lists the named ranges as report variables.
Note:
There are different editor options depending on personal preference. For more, see Quintessence equation editors.
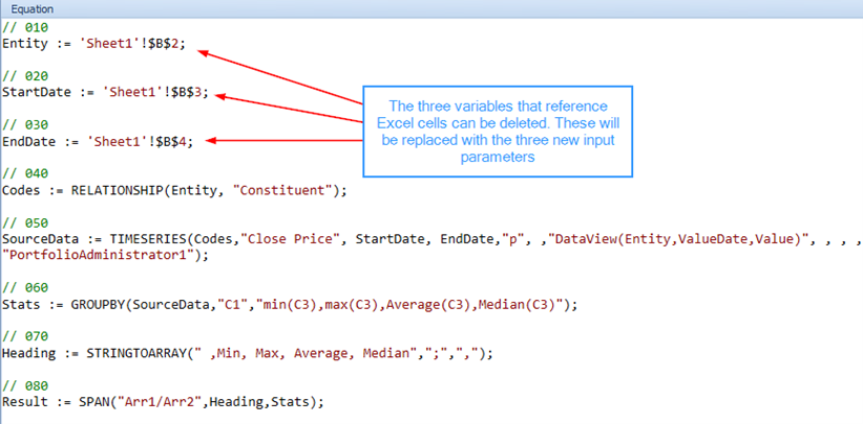
On switching to the other editor, the equation looks as follows:
Note:
The variables are ordered according to the Comments as entered in Excel – the order is not important, but aids readability. The last variable ‘Result‘ represents the final output.
- The first three variables (Entity, StartDate and EndDate) refer directly to locations in an Excel spreadsheet. Delete the first three variables, making the report generic and independent of Excel.
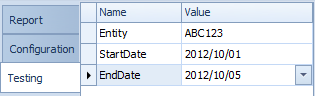
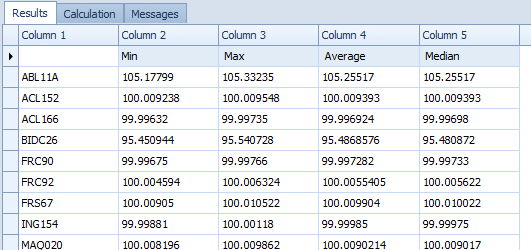
- Click on the Testing tab, enter test values next to the prompts and click on the Execute button to test the new report:
The results are displayed in the right hand window. If the report fails to calculate, the Results tab will be empty, and an error messages will be displayed on the Messages tab.
- Save the Price Statistics report and return to Excel.
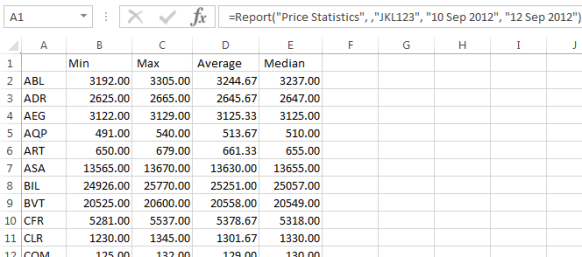
- Open a new spreadsheet. Enter the following Report() function with the required parameters entered in the correct order (Entity, StartDate and EndDate). Leave the second parameter empty as it is not required:
The output is the same as that of the Result function created in the StatsReport spreadsheet:
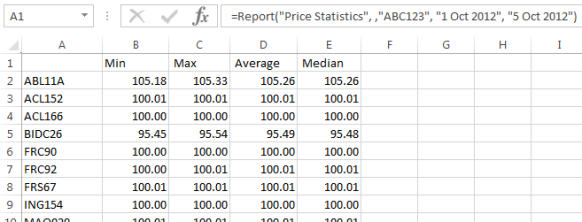
This report can now be accessed from any spreadsheet by any user, and only requires three input variables.
Test the report with a different entity and dates: